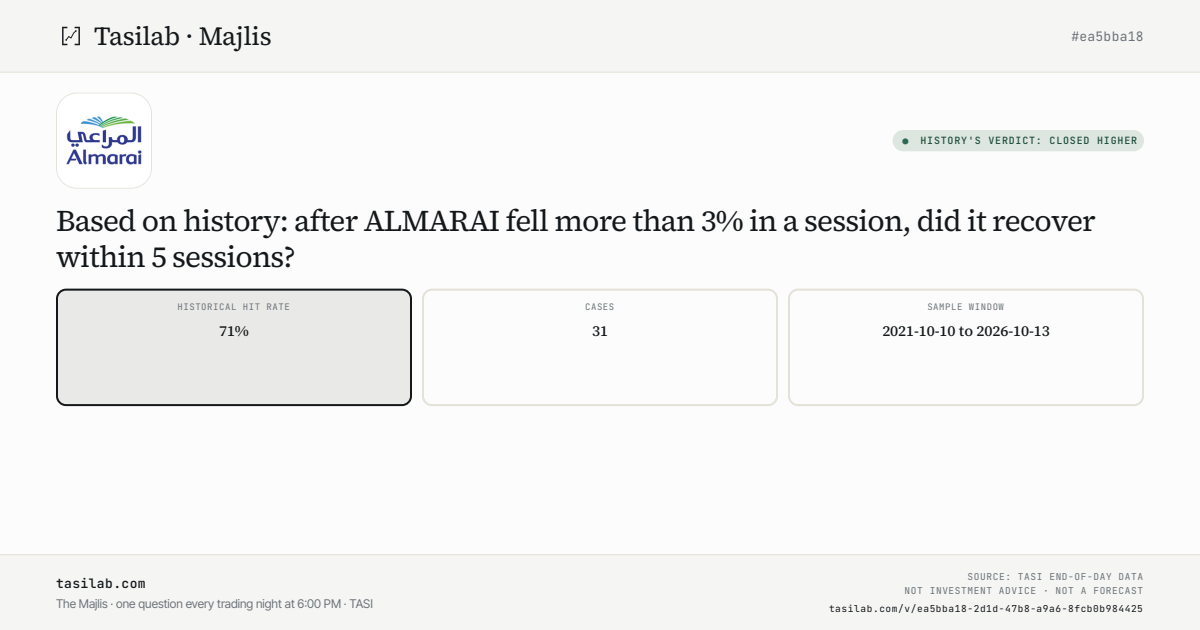
Based on history: after ALMARAI fell more than 3% in a session, did it recover within 5 sessions?
History's verdict: Closed higher
Historical hit rate
71%
Cases
31
Sample window
2021-10-10 to 2026-10-13
At other periods
| Trading days after | Ended higher | Normally | Average move | Normally | Times |
|---|---|---|---|---|---|
| 1 | 65% | 44% | +1.08% | 0.00% | 31 |
| 5tonight | 71% | 46% | +1.83% | +0.01% | 31 |
| 10 | 60% | 45% | +0.97% | −0.01% | 30 |
| 20 | 67% | 46% | +1.67% | 0.00% | 30 |
| 60 | 53% | 52% | +0.12% | +0.36% | 30 |
The 10-day row counts times up to 2026-07-05; later ones have no 10-day result yet.
The 20-day row counts times up to 2026-07-05; later ones have no 20-day result yet.
The 60-day row counts times up to 2026-07-05; later ones have no 60-day result yet.
Sample cases
| Date | Drop | Return | |
|---|---|---|---|
| 2026-10-01 | 0.0% | +5.8% | |
| 2026-07-05 | 0.0% | +2.0% | |
| 2026-01-05 | 0.0% | +4.1% | |
| 2025-04-06 | 0.0% | +4.2% | |
| 2024-12-17 | 0.0% | -1.0% | |
| 2024-08-05 | 0.0% | +0.9% | |
| 2024-01-30 | 0.0% | +4.4% | |
| 2024-01-23 | 0.0% | -3.9% | |
| 2023-10-23 | 0.0% | +6.0% | |
| 2023-10-12 | 0.0% | -3.8% | |
| 2023-10-09 | 0.0% | -4.2% | |
| 2023-08-31 | 0.0% | -0.9% | |
| 2023-08-22 | 0.0% | +2.8% | |
| 2023-08-02 | 0.0% | -4.4% | |
| 2023-07-30 | 0.0% | -8.2% | |
| 2023-06-19 | 0.0% | +2.7% | |
| 2023-06-08 | 0.0% | +20.4% | |
| 2023-02-27 | 0.0% | +1.3% | |
| 2023-01-26 | 0.0% | +2.8% | |
| 2022-11-27 | 0.0% | -0.4% |
Tasilab is a paper-trading sandbox for the Saudi Exchange. This is historical pattern analysis for educational purposes only — not advice, not a forecast; past performance does not predict future results. No real orders are placed. Tasilab is not licensed by the CMA.